4. WebUI
privacyIDEA comes with a web-based user interface which is used to manage and configure the privacyIDEA server. It is also used as a self-service portal for the average user, who manages his own tokens. This section gives an overview on the interface and links the respective sections in the documentation.
4.1. Serving the WebUI
Changed in version 3.14: The WebUI introduced in 3.12 is the one privacyIDEA serves. It moved from static_new/ into
static/, and the WebUI it replaces moved to static_old/.
An installation needs no configuration for this: the WebUI in static/ is what privacyIDEA
serves. If pi.cfg still carries the two lines that enabled the preview:
PI_STATIC_FOLDER = "static_new/"
PI_TEMPLATE_FOLDER = "static_new/dist/privacyidea-webui/browser/"
they can be removed. They still work – the paths are remapped to the new location and a warning is written to the log – but a future version will stop honoring them.
4.1.1. Serving the previous WebUI
The WebUI of version 3.13 and earlier is still shipped, in static_old/. To serve it instead,
add this line to pi.cfg:
PI_STATIC_FOLDER = "static_old/"
The templates privacyIDEA renders itself, such as the index.html of the previous WebUI, are read
from static_old/templates/ by default. PI_TEMPLATE_FOLDER only has to be set to
"static_old/templates/" as well if pi.cfg points it to a folder of your own.
It is kept so that a problem with the current WebUI does not hold up an update, and will be removed in a future version. If you need it, please report what made you switch back.
4.1.2. Serving the static assets efficiently
The WebUI is a compiled single-page application whose static assets (JavaScript and CSS) are served without compression by the application server. For optimal load performance, enable compression and caching for these assets at your web server / reverse proxy.
Compression. Enable gzip and, if available, brotli for the JavaScript and CSS responses (
application/javascript,text/css). This typically reduces the transferred size by a factor of four to five.Apache: enable
mod_deflate(andmod_brotliif available) for those MIME types.nginx: set
gzip on;(andbrotli on;with the brotli module) and includeapplication/javascriptandtext/cssingzip_types.
Caching. The build emits content-hashed file names (for example
main-<hash>.js), which are safe to cache indefinitely. SendingCache-Control: public, max-age=31536000, immutablefor the hashed assets lets returning users skip the download entirely. Do not apply long caching toindex.html, so that a new deployment is picked up immediately.
Each UI language is a separately compiled bundle, so users only download the assets for their selected language; the settings above apply equally to all languages.
4.1.3. Session persistence
The WebUI keeps the bearer token in web storage, so a page reload does not end the session. Where it keeps it is set by the session_persistence policy, which is evaluated for the user who logs in:
tab- the token goes tosessionStorage. It belongs to the tab it was created in, is gone when that tab closes, and a tab opened on its own has to log in for itself, so two tabs can hold different users. This is the default. Note that a tab opened from a logged-in one – Duplicate tab, or a window opened throughwindow.open– is handed a copy of itssessionStorageby the browser, and therefore of the session. Whether a link opened in a new tab, for example with a middle-click, also gets a copy depends on the browser and its version.browser- the token goes tolocalStorage. Every tab of the browser shares the session, and it survives closing the browser until the JWT expires.
The value is a deployment decision, not a user preference: the WebUI has no setting for it. Because the policy is matched against the principal that is logging in, admin realms and user realms can be given different values, and the audit log records the policy like any other.
A tab picks up the session it finds in its own sessionStorage first and the one in
localStorage second, so a session already open keeps the storage it was created in
even after the policy changes. Releases before 3.14 did not keep a WebUI session across
a page reload, so no session is carried over from them: after the upgrade, the WebUI
starts at the login page. The new value applies at the next login: that login also drops
a session left in the other storage when it belongs to the same user (same login name,
realm and role), so narrowing the policy takes effect for them there rather than at the
expiry of the old token. If the new login uses tab, the dropped session is the user’s
browser session, so their other tabs that use it return to the login page at their next
request. A session belonging to another user is never touched, so a tab session and a
browser session of different users can coexist. Two browser sessions cannot:
localStorage holds one token per browser, so a second login with browser replaces
it, and every tab using a browser session sends the new token from then on, even
while it still shows the earlier user until it is reloaded.
Logging out in one tab of a browser session takes the token away from all of them.
The others notice at their next request to the server: it is answered with 401, on which
the WebUI ends the session and returns them to the login page.
4.1.4. Hardening a browser-wide session
browser leaves a usable token on disk until it expires: whoever opens the browser
next is logged in, and every same-origin context – a frame, or a window opened through
window.open – can read it. Use it only on devices that are not shared. tab keeps
the token out of other tabs and windows, but not out of a same-origin frame in the same
tab, nor out of a tab opened from a logged-in one, which is handed a copy of the session
as described above. Unless PI_ENABLE_CSP is set, privacyIDEA sends no X-Frame-Options
or frame-ancestors header itself, so consider X-Frame-Options: DENY (or Content-Security-Policy:
frame-ancestors 'none') on the reverse proxy for either value.
Logging out discards the stored token but does not withdraw it: privacyIDEA checks a JWT
by signature and exp only, so a copied token stays usable until it expires. That
expiry is set by the jwt_validity policy, which is the only real upper
bound for both values. logout_time is an idle timer in the browser and does not
limit a token that has left it.
4.2. Dashboard
privacyIDEA includes a dashboard. The WebUI always shows the dashboard to administrators; the WebUI policy admin_dashboard only affects the previous WebUI. The dashboard is the default starting page for administrators; another one can be chosen as Landing Page in the UI Settings (gear icon next to the user name). The dashboard is made of panels that each administrator arranges for themselves: with Edit Dashboard, panels can be added (Add Widget), removed, moved and resized, and Save stores the layout for that administrator. By default it shows Authentication Activity, Token Usage, Tokens by Type, Certificate Health, Resolver Timing, Notification Delivery, Conditional Access Enforcements and Policies, plus News and Subscriptions, which keep a fixed place and cannot be removed. Panels that need a right the administrator does not have are left out. Further panels, such as Administration (recent administrative changes) and Events (event handler definitions), can be added. The dashboard uses the usual endpoints to fetch the information, so only information to which an administrator has read access is displayed in the dashboard.
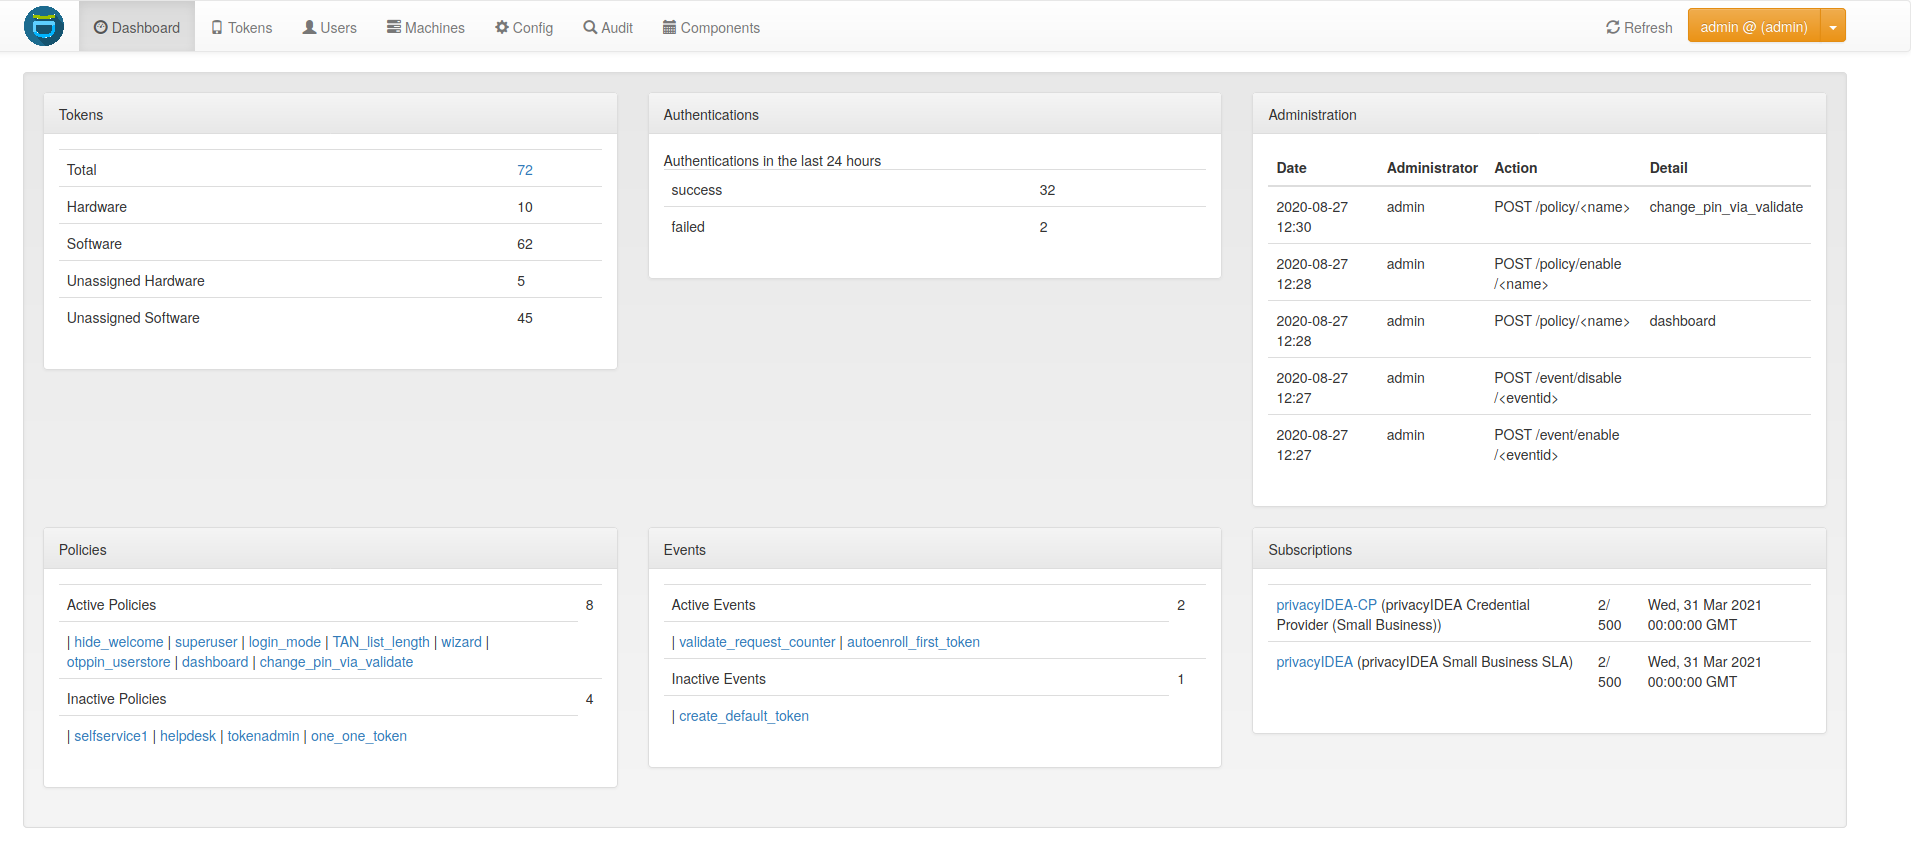
4.2.1. Token usage
The Token Usage panel counts the tokens of one realm - hardware and software tokens, and those not assigned to a user - and how many of the realm’s users own a token and how many do not. The realm is picked in the header of the panel and stored with it; without a choice, the default realm is counted. Each number links to the token or user list that shows what it counted.
The panel requires the admin action tokenlist. The two user counts (Users with tokens, Users without
tokens) also require userlist, and tokenlist in the counted realm, since they tell who owns a
token. For the user counts, a revoked token does not count, as it can never be used again; a disabled one does. The
token counts include revoked and disabled tokens, like the token list they link to. A resolver that does not answer is
left out of both user counts and named below them.
4.2.2. Certificate health
The dashboard also shows a Certificate Health panel listing TLS certificates that are relevant to the running privacyIDEA instance:
The certificate of every configured LDAP resolver that uses
ldaps://orSTART_TLS. Each entry links to the corresponding resolver detail page.The TLS server certificate of every Keycloak resolver whose
base_urlis anhttps://endpoint. The Entra ID resolver is intentionally not probed this way, because it targets Microsoft-managed endpoints whose certificates rotate automatically.The client-certificate credential of every Entra ID resolver configured with
client_credential_type = certificate. The certificate is read from the resolver’sprivate_key_file; only its validity period is inspected (the private key and its passphrase are never needed). If that file holds only the private key and no certificate, the entry is reported aserrorwith an explanatory message.Optionally, the privacyIDEA server certificate. Two opt-in sources can be configured in
pi.cfg; both are off by default.
To check the privacyIDEA server certificate, set one or both of:
PI_SERVER_CERT_FILE- absolute path to a PEM (or DER) certificate file on disk that the privacyIDEA process can read. Useful when the same process serves TLS, or when an operator has shared the reverse-proxy’s cert with the privacyIDEA user:PI_SERVER_CERT_FILE = "/etc/letsencrypt/live/auth.example.com/fullchain.pem"
PI_HEALTH_CERT_PROBES- list of{"host": "...", "port": int}endpoints that privacyIDEA opens a TLS connection to and reads the served certificate from. Targets must be reachable from the privacyIDEA process. Typical values:Apache + mod_wsgi (Ubuntu deb package):
[{"host": "127.0.0.1", "port": 443}]- probes Apache over loopback and reads the cert it actually serves.Docker (Caddy + gunicorn):
[{"host": "caddy", "port": 443}]or whatever the docker-compose service name resolves to inside the network.
A single probe target may also be given as a bare dict (
{"host": "...", "port": ...}) instead of a one-element list.Both keys are admin-controlled: probe targets are never derived from request headers, to keep the endpoint from being usable as an SSRF primitive.
Each row is classified by remaining validity and color-coded:
ok(green): more than 30 days remaining.warning(yellow): 30 days or less remaining.critical(red): 7 days or less remaining.expired(red): the certificate has already expired.error(gray): the probe failed (file not readable, timeout, connection refused, …).
The probe results are cached for PI_CERT_CHECK_CACHE_SECONDS seconds
(default 3600). Without PI_REDIS_CACHE_HEALTH (see
Certificate health results) each worker process keeps its own cache: saving or
deleting a resolver drops only the cache of the process that handled that
request, and the other processes keep their results until they expire. With
PI_REDIS_CACHE_HEALTH the results are shared, and saving or deleting a
resolver drops them for all workers and nodes. The cache can be bypassed
manually via the refresh button on the panel. Hit the panel data via
GET /system/health/certificates; add ?refresh=1 to skip the cache.
Because of that cache, the panel does not report a time window the way the
metric panels do, but the moment the endpoints were last reached: the line
below the table, and the checked_at field on every entry, name when the
certificates were probed rather than when the response was served. Use the
refresh button after replacing a certificate to see it right away.
4.2.3. Resolver timing
The dashboard also shows a Resolver Timing panel that summarizes the
latency of the operations of every resolver - check_pass,
get_user_list, get_user_id, get_user_info, get_username, and
so on - across LDAP, SQL, HTTP-based (HTTP, Entra ID, Keycloak), and passwd
resolvers. Each row is one operation of one resolver, with the columns
Resolver, Operation, Requests, Avg (ms), P95 (ms) and Max (ms).
The rows are sorted by p95 (or by the maximum where there is no p95),
highest first; a click on a column header sorts by that column. Only the P95 (ms) value
is color-coded (by the maximum where there is no p95): green below
100 ms, yellow below 500 ms, and red from 500 ms on.
p95 readings are approximated from prom-style cumulative histogram
buckets and so always round up to the next bucket boundary. The active
bucket boundaries are 50 ms, 100 ms, 150 ms, 200 ms,
250 ms, 500 ms, 1 s, 2 s, 5 s; anything above 5 s
is reported in the +inf tail, and a p95 that falls there is shown as
-. With only a few requests in the window, the p95 says little.
The window the panel is read over is chosen in its header: 1 h (the
default), 6 h or 24 h. The choice is stored with the
administrator’s dashboard layout, so it survives a reload and is that
administrator’s alone. A day is the widest window offered because the
metric store holds a day’s rows; see Storage and cleanup.
The data is read from GET /system/health/resolver_timing
(since_seconds, default 3600) and aggregates across all
privacyIDEA nodes.
4.2.4. Notification delivery
The Notification Delivery panel summarizes outbound message delivery across the three notification channels, in one table each:
Push - per configured push gateway identifier (column Gateway).
SMS - per configured SMS gateway identifier (column Gateway; HTTP, SMPP, SMTP-to-SMS, script). Push notifications are counted here as well, under the identifier of their push gateway.
Email - per configured SMTP server identifier (column Identifier).
Each row shows the successful deliveries (OK), the failed deliveries
(Failed) and the delivery errors (Error) in the window. A delivery counts
as failed when the gateway or SMTP server reports it as not sent, and as an
error when the attempt ends with an error; the SMS table counts errors as
failed, so its Error column stays 0. Only the Error cell is
color-coded: red if there was an error, yellow if there was none but a
delivery failed, and green otherwise. Gateways without deliveries in the
window are not listed. Reads GET
/system/health/notification_delivery (since_seconds, default
3600). The panel carries the same window picker in its header as
Resolver Timing, with the same three choices and the same storage.
4.2.5. Authentication activity
The Authentication Activity panel charts how authentication went over a chosen window. It counts authentication attempts rather than log entries: the several entries of one challenge-response login are reduced to the event that classifies the whole attempt, so a completed 2FA login counts once as a success instead of once as pending and once as successful. See Summarizing the log for the exact rule and its edges.
One row of bars per classification, with its count beside it and, where a share means anything, that too:
Overall - every attempt in the bucket, whatever it ended as. It carries no percentage: an event type the endpoint cannot classify counts here and in none of the rows below, so a share of the whole would read 100% at best and more than that wherever such an event type is in the window.
Successful, Failed and Pending - the three classifications, their shares taken against all attempts, pending included, so that the three add up to the whole. An attempt counts as pending while its latest entry is a challenge or enrollment with nothing logged after it, and its bucket is where the attempt started rather than where it expired.
Successful and Failed are charted to begin with. The button in the panel header chooses which rows to draw and the last one cannot be taken off; the choice lasts as long as the page is open and is not stored.
Below the bars, 1 h, 24 h, 7 d, 30 d and All choose the window and how finely it is bucketed - five minutes, an hour, six hours, a day. The day windows are cut on local midnights and take today in as far as it has got, so 7 d covers the last seven whole days plus today, four buckets to a day and one for 30 d. All runs from the log’s own first entry to now, an extra request the panel makes to find where that is before it can ask for the window itself; its bucket count is capped the same way any other window’s is, so a log that spans a long time is cut coarser rather than rejected for asking too many buckets. The slider beside the buttons narrows the selection to whole buckets inside the fetched window: every count, share and reason in the panel then answers for the selected span rather than for the window around it.
Failure Reasons lists the event types behind the failures of that span, most common first. A reason links to the authentication log filtered on that event type and on the selected span; a bar links to the log filtered on its own bucket’s span alone.
Note
A bar’s drill-down deliberately carries no event-type filter. This panel
counts attempts, each reduced to the one event that classifies it, while
the log lists the entries an attempt is made of: an attempt that ended in
success can hold a PIN_FAIL entry on the way there, so a log filtered
to the failure event types would list entries belonging to attempts the
panel counted as successful.
The panel reads GET /authenticationlog/statistics and is offered to
administrators holding authentication_log_read
(see authentication_log_read); its title links to the full
log. A policy scoped to realms, resolvers or users narrows what is counted
the same way it narrows the log listing, so a scoped administrator’s bars
only cover the attempts they may read.
4.2.6. Conditional access
The Conditional Access Enforcements panel summarizes what the conditional-access policies are configured to do and what they are currently enforcing:
Enforcing policies - enabled policies whose actions actually run. Policies in dry-run mode are counted separately, since they only record what they would have done, and disabled policies are counted on their own as well.
Users locked and IPs blocked - the locks and IP blocks in force right now, with the permanent ones broken out below the total. A non-zero count is highlighted red, a zero count green.
Expired records - locks and blocks whose time has run out. They restrict nobody, and are what the purge action on the Locked Users and IP Blocklist pages removes.
Blocks and locks over time - a histogram of when restrictions were imposed, read from the conditional-access outcomes recorded on the authentication log. Only the request that imposed a restriction counts, not the many that were later turned away because a user was already locked - those are authentication failures, and the Authentication Activity panel is where they are counted. Dry-run outcomes are left out as well: they record what a policy would have done.
The Users / IPs buttons choose which kinds of restriction are charted (both to begin with, and the last one cannot be taken off): user locks, permanent ones included, and IP blocks. The window buttons and the slider work as they do on the Authentication Activity panel, and the section header reads how many restrictions fall inside the selected span. A bar links to the authentication log filtered on that bucket’s span - on time alone, deliberately: what explains a lock is the run of failures before it, and those carry no outcome of their own.
Restrictions in force - every restriction still in force that was imposed inside the selected span, blocked IPs and locked users in one list, most recent first. An IP links to the authentication log pre-filtered on that source IP, a user to the Locked Users page; a footer names how many further restrictions the list does not show (those outside the span, and any beyond the 100 lock records read). With no histogram to brush over - an administrator without the log’s right, say - the list is not narrowed at all.
Every top-level row - Enforcing policies, Users locked, IPs blocked -
links to the page it summarizes; their permanent/dry run only/disabled
sub-counts and Expired records do not. The three areas are governed
by separate rights (conditional_access_policy_read, user_lock_read,
blocklist_read); the panel shows only the areas an administrator may
read and is offered as soon as any one of the three is granted. It reads
the regular endpoints
GET /conditionalaccess/policy, GET /conditionalaccess/lock/users
(once per lock state for the counts, plus once more for the records behind
Restrictions in force above) and GET /conditionalaccess/blocklist.
The history is the exception: it hangs off the authentication-log entries
that caused it, so it is read under authentication_log_read rather than
under any of the three, from
GET /conditionalaccess/outcomes/statistics. An administrator holding the
conditional-access rights alone keeps the numbers and the restrictions list
and simply gets no histogram; realm scoping applies to it as it does to the
log itself.
4.2.7. Locking a user or an IP by hand
A restriction does not have to come from a Conditional Access policy. The User Lock State card on a user’s details page offers a Lock action, and the IP Blocklist page a Block IP action; both ask whether the restriction lasts until an administrator lifts it (the default) or for a chosen duration.
The Locked Users and IP Blocklist pages show a Cause column reading Manual or Policy, and the locked-users list can be filtered on it. What a manual restriction does at authentication time, how its cause moves when a policy strengthens it, why a manual write is authoritative where a policy’s is not, and which rights it needs are described in Locking or blocking by hand.
4.2.8. Storage and cleanup
The Resolver Timing and Notification Delivery panels both read from a
single pre-aggregated table (metric_aggregate). Each row holds a
counter or histogram for a 5-minute window, partitioned by the writing
node, so per-request overhead stays low.
The table grows unbounded unless something deletes the old rows. The
Ubuntu packages and the Docker image run pi-manage config metrics cleanup
daily, which deletes the rows older than 24 hours and so keeps the table at
roughly two days’ worth of rows; on an installation from PyPI you have to
schedule it yourself, see Cleanup Jobs. Each run is a single indexed
DELETE, so cost is negligible.
If you need to turn the whole feature off, set PI_NO_INTERNAL_METRICS = True
in pi.cfg. With that flag every observe / inc call short-circuits
before touching the database; the dashboard panels will simply show no data.
Reads remain available, and the cleanup continues to work.
4.3. News
privacyIDEA can fetch news via RSS feeds. This is supposed to help the administrator to keep up with information with regard to running privacyIDEA. Per default privacyIDEA fetches news from privacyidea.org, netknights.it and community.privacyidea.org.
News is shown to administrators by default, with the messages of the last 180 days. Users only see news when an rss_age policy with a value above 0 applies to them.
You can use the policy rss_age to define the age of the messages to fetch and the policy rss_feeds to define the feeds to fetch. This way you can even provide your own feeds to your end users.
Setting rss_age to 0 hides the News page; the News panel of the dashboard then says that the news feed is
disabled.
4.4. Tokens
The administrator can see all the tokens of all realms he is allowed to manage in the tokenview. Each token can be located in several realms and be assigned to one user. The administrator can see all the details of the token.

Tokens overview
The administrator can click on one token, to show more details of this token and to perform actions on this token. Read on here:
Under Applications in the token menu, the administrator can check for all SSH Keys attached to services and for HOTP tokens attached to machines for offline authentication. Also see Applications and Machines or Services.
4.5. Containers
In the container view, administrators can see all the containers in all the realms they are allowed to manage. Users can only see their own containers. Each container can hold multiple tokens. A container can be in multiple realms, but can only be assigned to one user. You can click on a container to see more details and perform actions on the container and the tokens it contains.

Container List
More details about the container view can be found here:
4.6. Users
The administrator can see all users fetched by User ID Resolvers located in Realms he is allowed to manage.
Note
Users are only visible, if the useridresolver is located within a realm. If you only define a useridresolver but no realm, you will not be able to see the users!
You can select one of the realms in the Select Realm drop-down box. The administrator will only see the realms in the drop-down box, that he is allowed to manage.
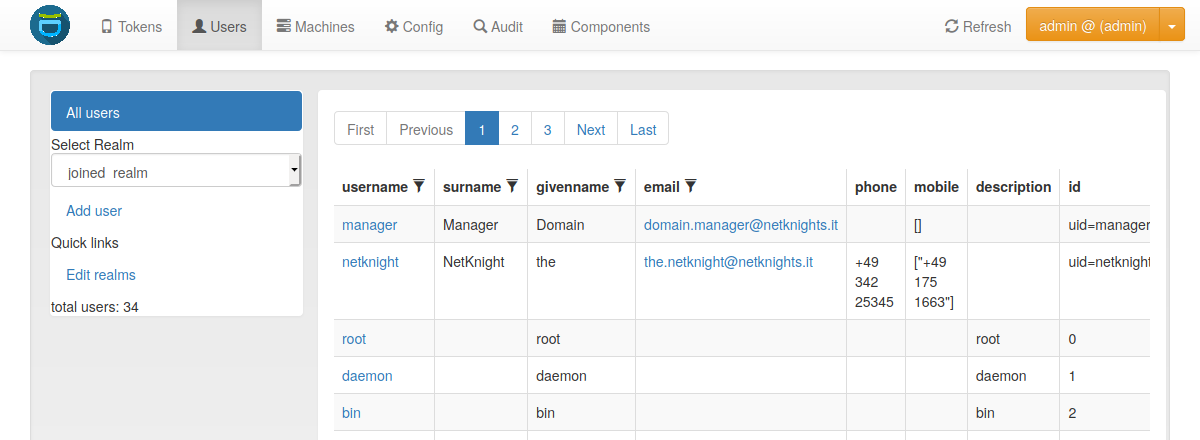
The Users view lists all users in a realm.
The list shows the users from the selected realm. The username, surname, given name, email and phone are filled according to the definition of the useridresolver.
Even if a realm contains several useridresolvers, users from all resolvers within this realm are displayed. However, if a user with the same login name exists in more than one resolver, only the user from the highest-priority resolver is shown. See Resolver Priority for details. If the administrator’s userlist policies name resolvers or users, only these are listed.
The filter has_tokens: true lists only the users that own a token, and
has_tokens: false only those that own none. It is offered to administrators
with the tokenlist action, which it requires in the listed realm.
Read about the functionality of the users view in the following sections.
4.7. Machines
Under Configuration > Machines, the machines fetched by the configured machine resolvers are listed. Machines are only necessary if you plan special use cases like managing SSH keys or doing offline OTP. In most cases there is no need to manage machines and this view is empty.
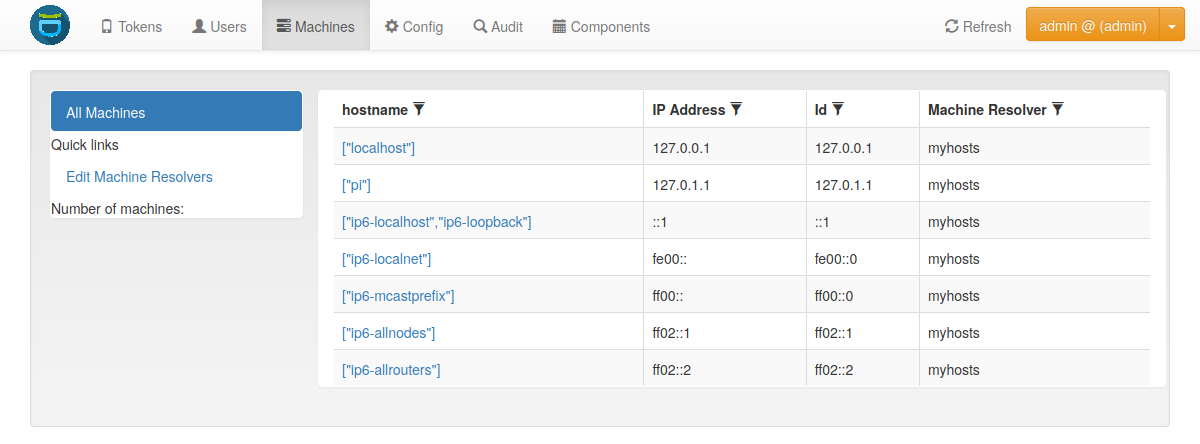
The Machines view.
4.8. Configuration
The Configuration menu is the heart of the privacyIDEA server. It contains the general System Config and lets the user set up Periodic Tasks. The Policies, which are important to configure behavior of the system, and the Event Handler are managed under the separate menu Policies.
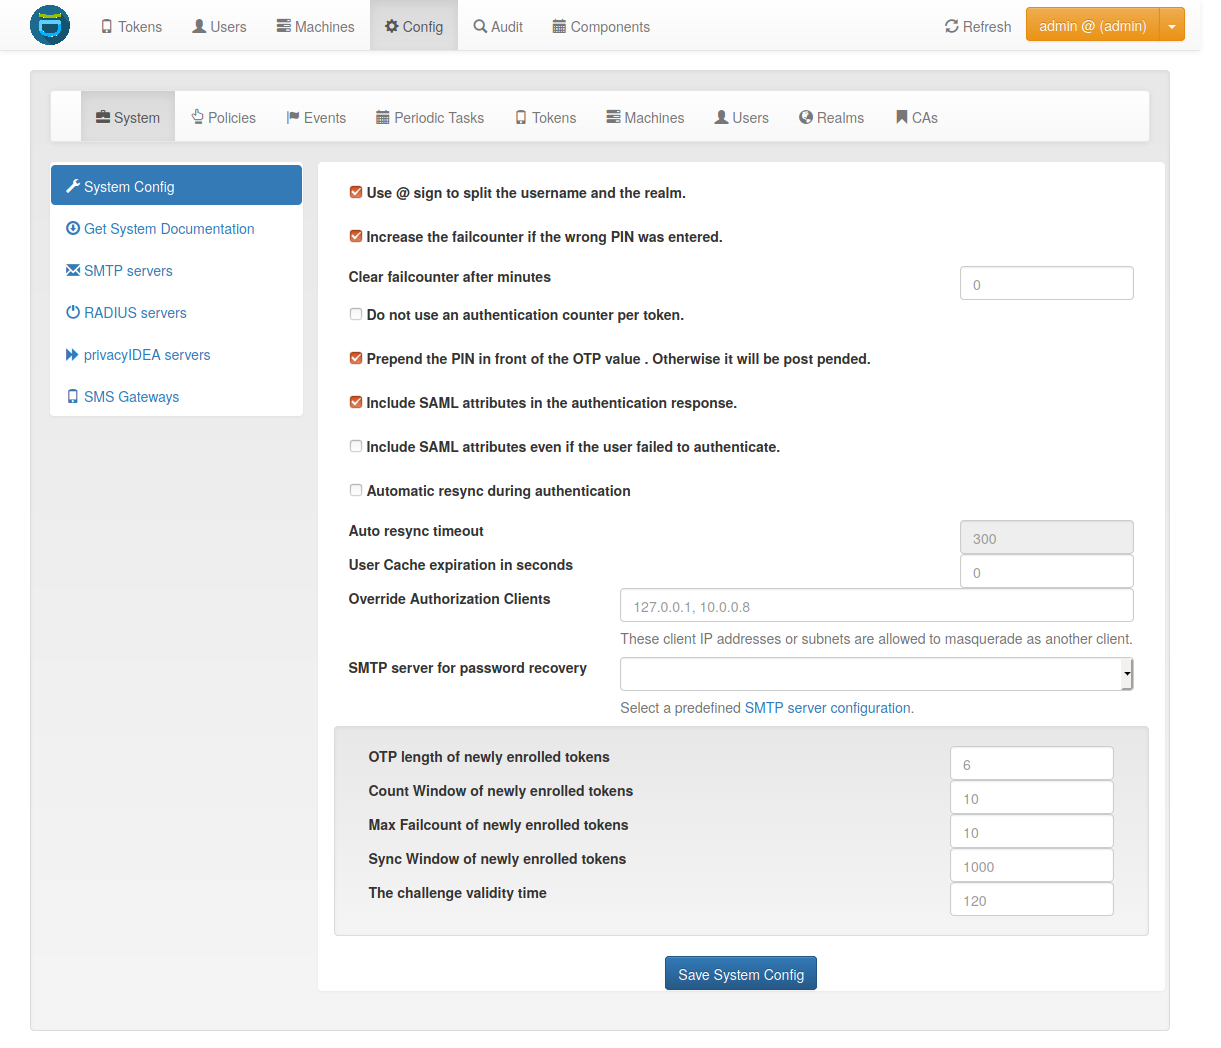
The Config section is the heart of the privacyIDEA server.
4.9. Audit
In this tab, the Audit log is displayed which lists all events the server registers.
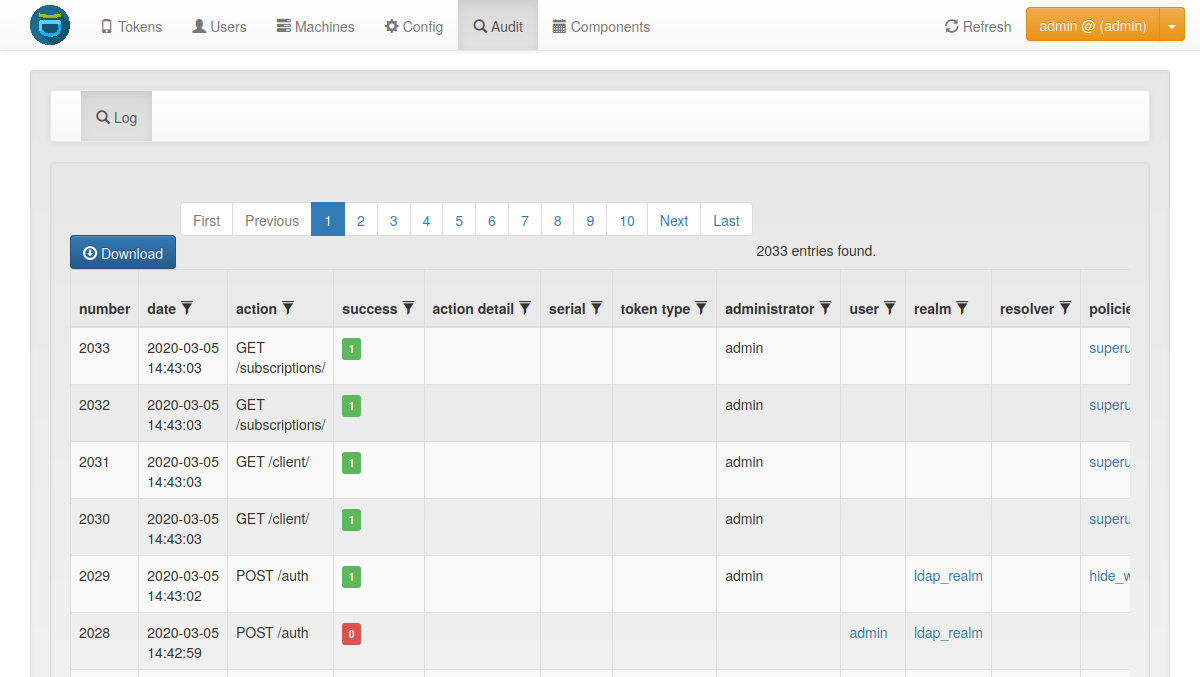
Events can be displayed in the Audit log.
4.10. Authentication log
In this tab, the Authentication Log is displayed which lists how every authentication request was decided: the event, the reason behind it, the endpoint that served the request and what conditional access did about it.
4.11. Known Clients
privacyIDEA collects authenticating clients with their User Agent and lists them under Audit > Known Clients. Usually this is a type like PAM, FreeRADIUS, Wordpress, OwnCloud, … For more information, you may read on Application Plugins. This overview helps you to understand your network and keep track of which clients are connected to your network.
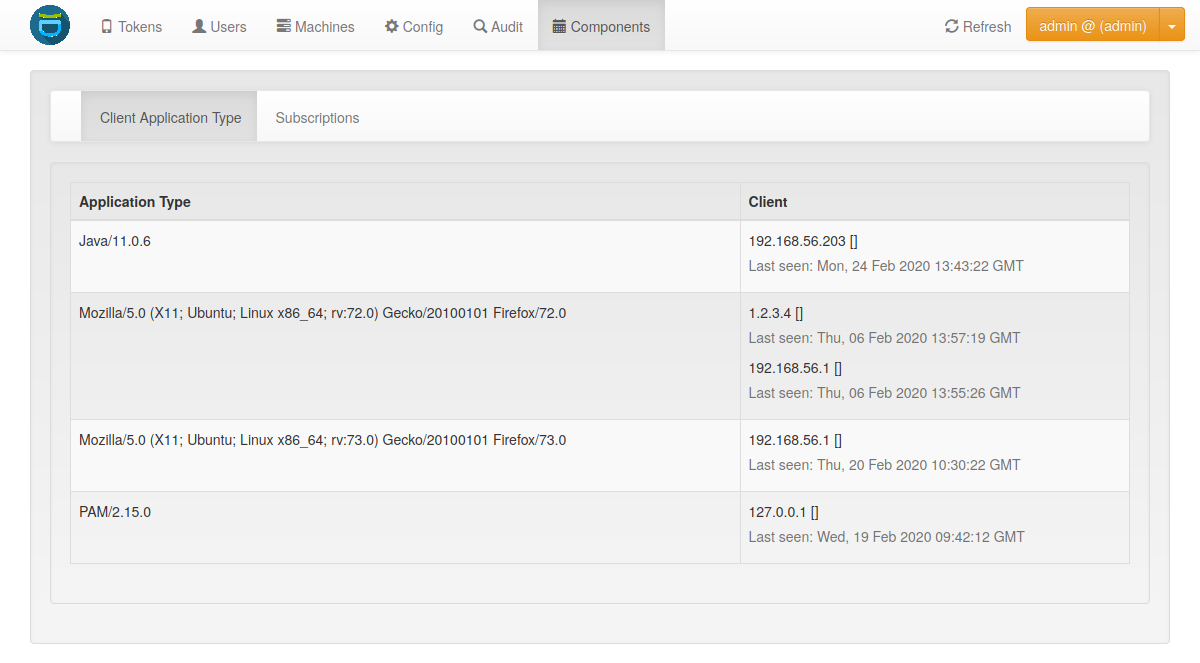
Known Clients lists the client applications that have authenticated.
Subscriptions, e.g. with NetKnights, the company behind privacyIDEA, can be viewed and managed in the menu Subscription.